
Price action patterns are technical chart patterns that traders use to analyze price movements in financial markets. They are formed by the price movement of an asset over time and can provide insights into potential future price movements. One popular price action pattern is the double bottom pattern, which is characterized by a specific formation on a price chart. In this article, we will explore the anatomy of the double bottom price action pattern, its significance, and how to trade it effectively.
Anatomy of the Double Bottom Pattern:
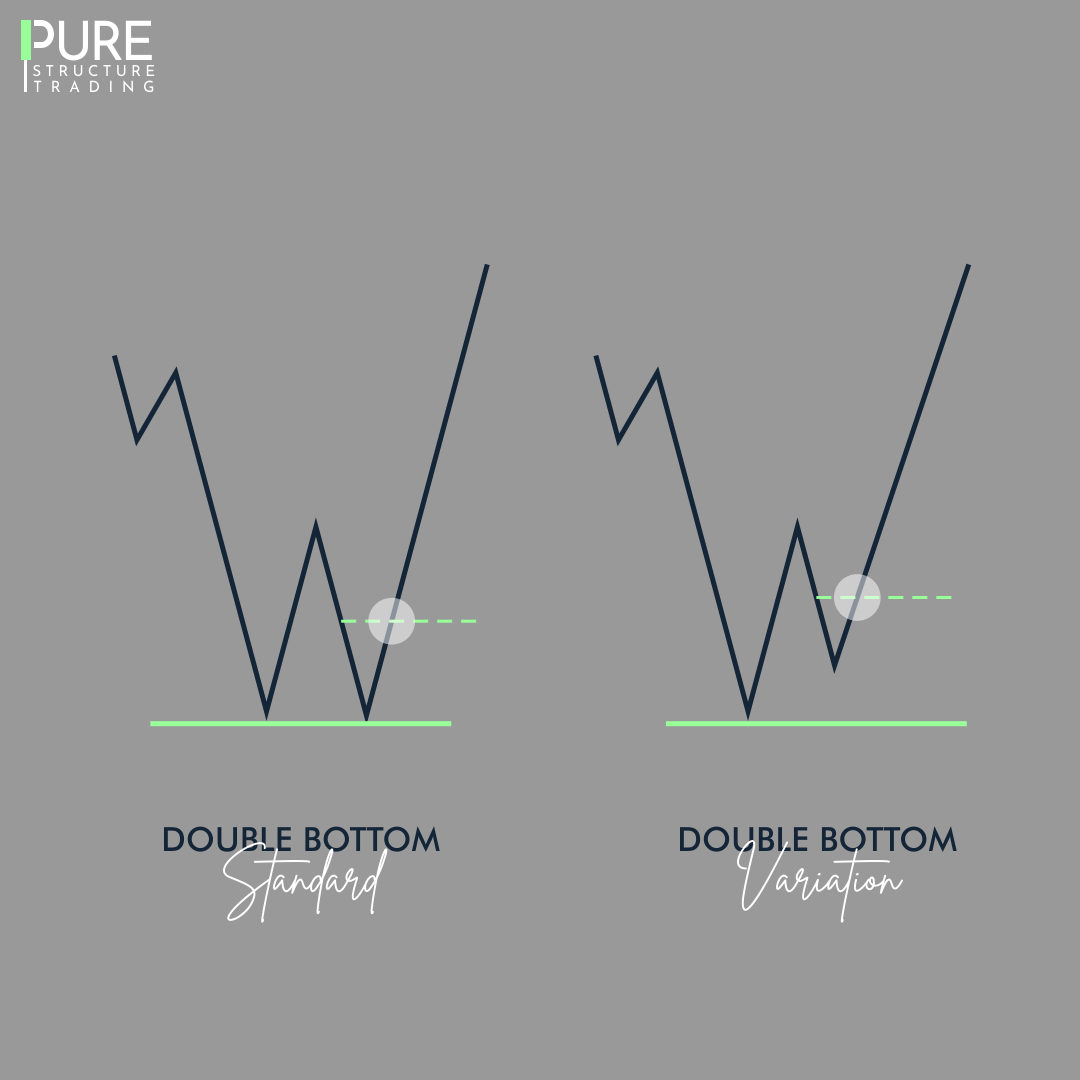
The double bottom pattern is a bullish reversal pattern that forms after a downtrend. It consists of two consecutive troughs (lows) that are approximately at the same level, followed by a price rally. The pattern resembles the letter “W” and can be present on any timeframe. The first trough is formed as the price reaches a low point during the downtrend, followed by a temporary rally before the price falls again to form the second trough at a similar level as the first. The pattern is confirmed when the price breaks above the high point between the two troughs, known as the neckline.
Significance of the Pattern:
The double bottom pattern is considered significant because it indicates a potential reversal of the downtrend and a bullish trend reversal. It suggests that the selling pressure has weakened, and buyers may be stepping in to push the price higher. The pattern is often seen as a bullish signal and can provide traders with an opportunity to enter long positions, expecting the price to continue to rise.
How to Trade the Double Bottom:
To trade the double bottom pattern, traders should first identify the pattern on a price chart. This can be done by visually observing the formation of two troughs at approximately the same level, followed by a breakout above the neckline. Traders can also use technical indicators such as moving averages, trend lines, or candlestick patterns to confirm the pattern.
Once the pattern is identified, traders can enter a long position when the price breaks above the neckline, with a stop-loss order placed below the second trough. The target for the trade can be set by measuring the height of the pattern (the distance from the neckline to the trough) and adding it to the breakout point. This can provide an estimate of the potential price target for the bullish reversal.
It’s important to note that no trading strategy is foolproof, and traders should always use proper risk management techniques, such as setting stop-loss orders, to protect their capital.
Conclusion:
In conclusion, the double bottom price action pattern is a bullish reversal pattern that can provide traders with an opportunity to enter long positions after a downtrend. By identifying the pattern on a price chart and confirming it with technical indicators, traders can potentially capitalize on the trend reversal and profit from the subsequent price rally. However, like any trading strategy, the double bottom pattern is not without risks, and traders should always use proper risk management techniques when trading. By understanding the anatomy and significance of the double bottom pattern, traders can incorporate it into their trading strategies and potentially improve their trading performance.


0 Comments